When analyzing the American political landscape, political slogans often obscure factual data. Different governing models lead to measurable differences in healthcare, economics, and community safety.
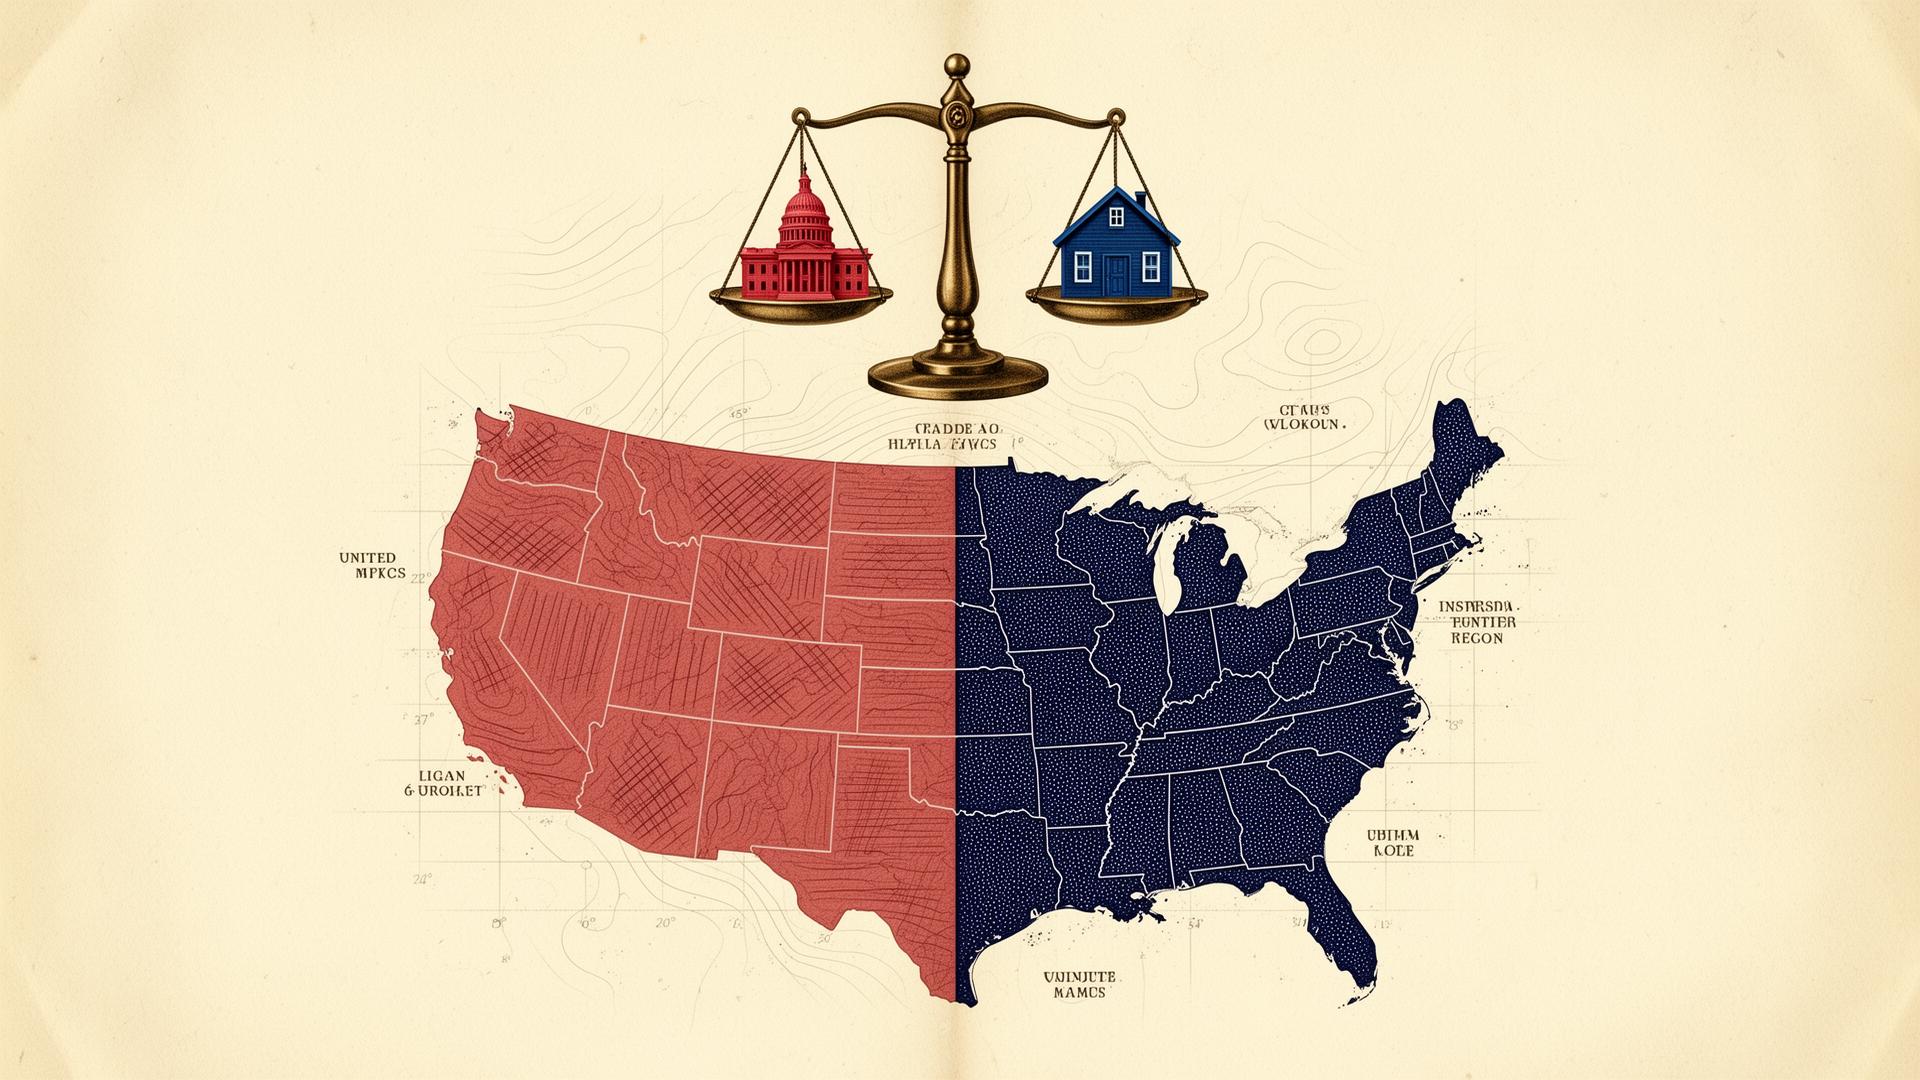
1. Data Snapshot: Red States vs. Blue States
| Category | More Common in Blue States | More Common in Red States |
|---|---|---|
| Healthcare | Higher insurance coverage rates; broader Medicaid expansion. | Lower health coverage on average; lower localized baseline costs. |
| Education | Higher per-student funding; higher average teacher pay scales. | Lower average funding; stronger emphasis on school choice models. |
| Economy | Higher average wages; higher tax rates; elevated housing costs. | Lower tax rates; more affordable real estate; lower average wages. |
| Policy Approach | More centralized public services and statewide regulations. | De-regulated frameworks emphasizing decentralized local control. |
Important Demographic Variables
- Significant fiscal and structural overlap exists between individual states.
- Urban vs. rural density differences often matter more than partisan control.
- Geography, native industries, and local population trends heavily influence outcomes.
2. Public Safety Myths vs. Per Capita Realities
Public safety is frequently weaponized in political rhetoric. Political campaigns often point to massive blue-state metropolitan hubs like Los Angeles, Chicago, or New York City as the primary centers of violent crime.
This talking point relies on raw totals. Because millions of people live in these cities, their total crime counts look large. However, epidemiologists and data analysts measure societal risk using per capita rates. This evaluates the number of incidents per 100,000 residents to create a fair comparison.
When you look at official data from the CDC Firearm Mortality Databases, the highest death rates are not found in major blue urban hubs. Instead, the highest age-adjusted firearm mortality rates are concentrated in states with highly decentralized gun laws.
According to multi-year tracking briefs via USAFacts Homicide Research, states like Mississippi, Louisiana, and Alabama consistently record the highest per capita murder rates in the country. For instance, Mississippi averages nearly 20 homicides per 100,000 residents. Meanwhile, California sits far lower at roughly 4.5, and New York records a stable 2.7 per 100,000.
3. How Policies Affect Everyday Life
Healthcare
Expanded programs: More residents qualify for public safety nets.
Market-focused systems: More insurance plan variety, but broader coverage gaps.
Education
Higher funding: Upgraded classrooms and more competitive teacher salaries.
Local control: Vast variations in school quality across county lines.
Jobs and Income
Lower taxes: Increased immediate take-home pay on your paycheck.
Higher public spend: More robust services, paid via higher tax brackets.
Cost of Living
Low regulation: Cheaper structural real estate and manufacturing costs.
High regulation: Skyrocketing local demand driving up urban housing prices.
4. Understanding the Parties: Key Priorities
Republican Focus (General Patterns)
- Lower individual tax brackets and sweeping corporate deregulation.
- Protecting state authority from federal mandates.
- Promoting market-driven economic growth and strong defense funding.
Historical Examples: Major federal tax cuts passed in 1981, 2001, and 2017.
Democratic Focus (General Patterns)
- Expanding federal safety nets for healthcare and higher education access.
- Enforcing environmental regulations and workplace labor rights.
- Using progressive taxation to invest in public infrastructure.
Historical Examples: Passage of the Affordable Care Act and federal student aid models.
5. The Philosophical Divide and Budgetary Realities
Every policy choice requires a functional sacrifice. Most political fights are not about what a society wants to achieve. They are about the structural tools chosen to get there.
The Fiscal Trade-Off Principle
- Lower tax brackets leave money in pockets but reduce public infrastructure budgets.
- Expanded safety nets protect vulnerable communities but require a higher tax base.
- Strict corporate regulations maximize public safeguards but raise retail consumer prices.
The Strategic Takeaway
Governing differences reflect a core disagreement over the ideal role of the state. One side views collective public investment as the best path to stability. The other trusts decentralized market competition. True political literacy requires looking past campaign rhetoric and analyzing the hard, age-adjusted data.