When comparing different state policies, voters often want to know the bottom line. How do different legislative approaches translate into real-world household math?
Slogans frequently compress complex economics into simple soundbites. To look past the noise, we must evaluate objective state-level averages. Let’s look at the financial and structural data shaping local family budgets.
1. The Household Budget Simulator
How far does your paycheck actually go? Use this interactive matrix to simulate how regional tax averages and cost structures impact a baseline salary.
High-Tax / High-Service Model
Low-Tax / Low-Service Model
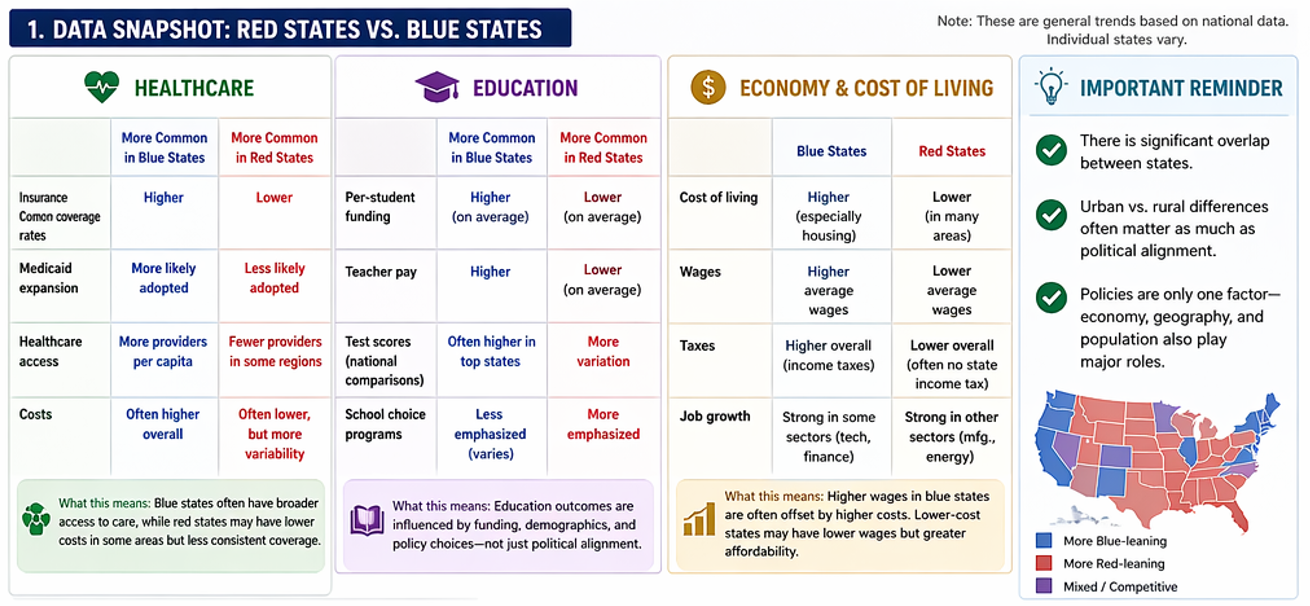
2. Healthcare Access and Coverage Standards
Healthcare systems are heavily impacted by state-level legislative policy choices. This results in contrasting safety net metrics across regions.
Insurance Coverage Rates
Blue State Averages: Statistically lower uninsured numbers due to aggressive localized marketplace auto-enrollments.
Red State Averages: Elevated uninsured populations on average, particularly among working-class families.
Medicaid Expansion Choices
Blue State Averages: Almost universal adoption of federal expansion funding to widen safety net qualifications.
Red State Averages: Higher rates of legislative resistance to expansion, preferring localized work requirements instead.
Medical Resource Densities
Blue State Averages: Higher per capita density of specialized primary medical providers in urban hubs.
Red State Averages: Notable provider shortages, particularly within rural county infrastructure lines.
The Trade-Off: High-investment states secure wider coverage access. However, their systems often feature higher baseline medical care costs and premium footprints.
3. Public Education Funding and Structural Outcomes
Because states control public school mechanics, educational environments diverge sharply across state boundaries.
Per-Student Financial Allocations
Blue State Averages: Significantly higher per-pupil funding footprints, supported via higher localized tax asset classes.
Red State Averages: Lower operational per-pupil benchmarks, prioritizing lean fiscal overhead requirements instead.
Public School Teacher Pay Scales
Blue State Averages: Elevated average starting salaries designed to boost long-term retention rates.
Red State Averages: Lower average base pay scales, frequently balanced by lower regional housing costs.
School Choice Legislation
Blue State Averages: Strong fiscal protection centered primarily around traditional public school models.
Red State Averages: High priority placed on state voucher systems, charter growth, and private choices.
4. Economy, Wages, and the Cost of Living Balance
The ultimate policy trade-off centers on the relationship between your paycheck size and your community’s cost structure.
The Real Estate Affordability Gap
Blue State Averages: Highly restrictive zoning and high consumer demand trigger skyrocketing urban housing prices.
Red State Averages: Streamlined development regulations and land access yield highly affordable residential options.
Average Annual Take-Home Wages
Blue State Averages: Concentration of corporate tech and finance hubs drives higher baseline wage availability.
Red State Averages: Leaner baseline corporate structures result in lower average individual employee earnings.
State Income Tax Structures
Blue State Averages: Progressive multi-tiered tax systems designed to fund wider public infrastructure arrays.
Red State Averages: Heavy reliance on flat taxes or complete lack of a state income tax footprint.
The Analytical Baseline
True financial planning requires looking past simple regional totals. Every voter navigates an intentional systemic trade-off:
- Higher localized wages are continually offset by elevated cost-of-living index structures.
- Lower-cost regions offer immediate affordability but feature lower structural public investments.
- Urban vs. rural divides across county lines often impact families more than state-level party control.